Logstash and GrayLog2 - Scaling your Logging
Logging visibility when scaling
Every decent app produces some kind of logging. Traditionally, this has been achieved by wrapper such as log4net, slf4j log4j and many others. The information it produces is invaluable as it’s usually the only source of information when troubleshooting issues.
As you scale and increase the amount of boxes and systems that you manage, this all becomes a lot more challenging and it’s easy to lose visibility. If you manage 30 boxes, you’re not going to check every single one of them for logs - it’s cumbersome and too painful. The chance of missing a defect or a misbehaving service also grows.
Logstash
This is where Logstash comes in, it’s an open-source framework to manage events and logs. In a nutshell, Logstash can take a variety of inputs, apply filters and transformations on the data that comes in and then push them forward to another store.
As an open source project, it contains a massive amount of plugins. Just to name a few
- Inputs - collectd, raw files, elasticsearch, gelf, unix, s3, redis, rabbitmq
- Outputs - cloudwatch, boundary, elasticsearch, gelf, graphite, sdout
- Codecs - JSON, dots, multiline, fluent, graphite and many more
To check out a full list, go to the logstash documentation.
Configuring Logstash
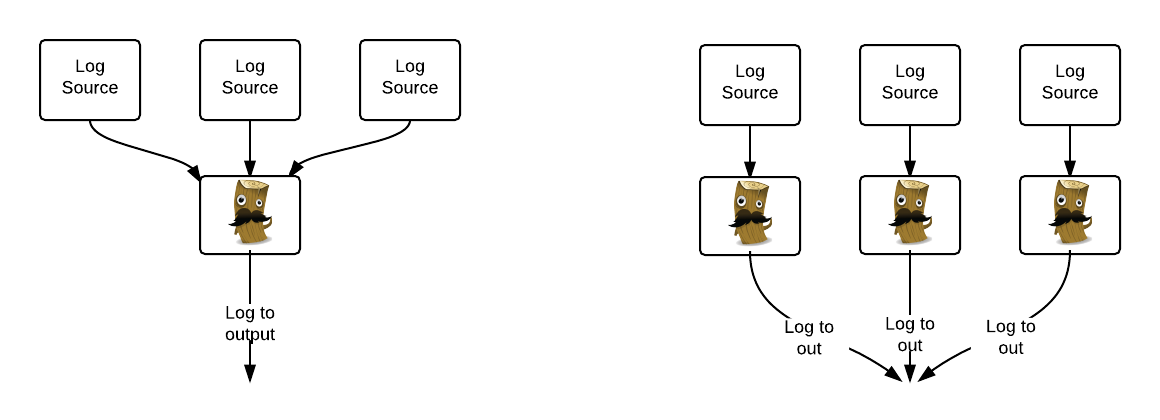
Each Logstash instance can be configured with multiple inputs and outputs and the topology very much depends on your use cases. For example, you may chose to run a single centralised instance of logstash with configs pointing to each separate box or on the contrary, run logstash on every instance.
Did I meantion Logstash has the best logo in the universe?
Log4net/Log4j and Logstash
In my scenario, I was looking to collect multiple logs from multiple apps on a large number of boxes across multiple data-centres. Each of the apps already had logging, which was mostly based on log4net.
Rather than having a separate configuration for each logstash instance, it was much simpler to use the UDP plugin from logstash. This means the existing apps just added a new appender that would log to an UDP port and logstash would just pick that up.
This made the whole logstash config really simple
1    input {
2        udp {
3          port => 5960
4          codec => plain {
5            charset => "UTF-8"
6          }
7          type => "log4net"
8        }
9    }
Changes to the Log4net appender were straight-forward too.
 1...
 2        <appender name="UdpAppender" type="log4net.Appender.UdpAppender">
 3            <RemoteAddress value="127.0.0.1" /> <!-- set to 127.0.0.1 and host name mapped to this on my machine (port 80) -->
 4            <RemotePort value="5960" />
 5            <layout type="log4net.Layout.PatternLayout">
 6                <conversionPattern value="%date [%thread] %-5level - %property{log4net:HostName} - MyApplication - %message%newline" />
 7            </layout>
 8        </appender>
 9....
10add the appender to the root loggers
11....
12		<root>
13			<level value="ERROR" />
14			<appender-ref ref="OutputDebugStringAppender" />
15			<appender-ref ref="TraceAppender" />
16			<appender-ref ref="ErrorFileAppender" />
17			<appender-ref ref="UdpAppender" />
18		</root>
Adding Graylog2 into the mix
Graylog2 is one of my favourite tools. The sole purpose is to aggregate and analyse logs in real time. With elastic search sitting underneath, it let’s you do complex queries on the data and create custom dashboards.
If you have an instance of Graylog2 running somewhere, it’s easy to use the gelf output to channel all the incoming logs into Logstash into Graylog2. The full logstash config could then look something like this:
 1input {
 2	udp {
 3	  port => 5960
 4	  codec => plain {
 5		charset => "UTF-8"
 6	  }
 7	  type => "log4net"
 8	}
 9}
10
11
12filter {
13  if [type] == "log4net" {
14    grok {
15      remove_field => message
16      match => { message => "%{TIMESTAMP_ISO8601:sourceTimestamp} \[%{NUMBER:threadid}\] %{LOGLEVEL:loglevel} +- %{IPORHOST:tempHost} - %{GREEDYDATA:tempMessage}" }
17    }
18    if !("_grokparsefailure" in [tags]) {
19      mutate {
20        replace => [ "message" , "%{tempMessage}" ]
21        replace => [ "host" , "%{tempHost}" ]
22      }
23    }
24    mutate {
25      remove_field => [ "tempMessage" ]
26      remove_field => [ "tempHost" ]
27    }
28  }
29}
30
31output {
32  gelf {
33	 host => "your-host-name"
34	 custom_fields => ["environment", "PROD", "service", "BestServiceInTheWorld"]
35	 }
36  stdout { }
37}
A result will be a centralised stream of logs that you can easily analyse and create dashboards from. The beauty of logstash is that you can easily add further outputs (eg graphite).